Hopsan has a built-in tool for estimating energy efficiency and identifying power losses in a model. To use this, first simulate the model and then click the "Calculate Losses" icon:
| Calculate Losses |
Added or consumed energy in each component is calculated by summing up the added or removed energy in each port. It does not separate useful energy from losses automatically, simply because this depends on how "useful" is defined. The total energy in a model is thus always conserved.
The energy efficiency tool will open a bar plot with total added or consumed energy for each component. Components with insignificant energy flow can be discarded by choosing a percentage limit in the dialog. The values for each component will also be shown in the workspace. These labels can be turned off by clicking the icon again.
Example
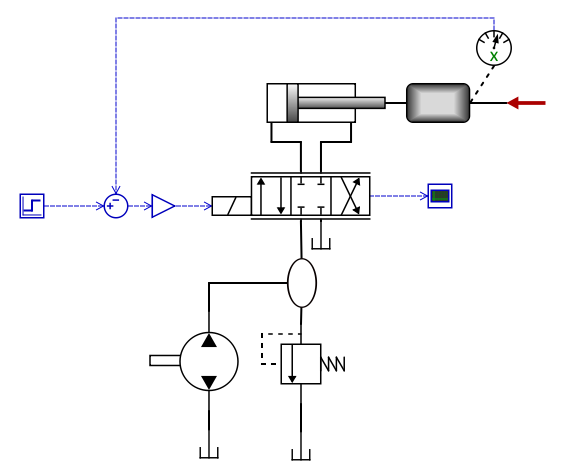
As an example, let's use the "Position Servo" model (found under Help-Examples Models). This uses a constant pressure system with a fixed pump and a pressure relief valve. This is a common, but very energy inefficient solution. The pump will always supply flow to the system, and pressure will be maintained by the pressure drop over the relief valve.
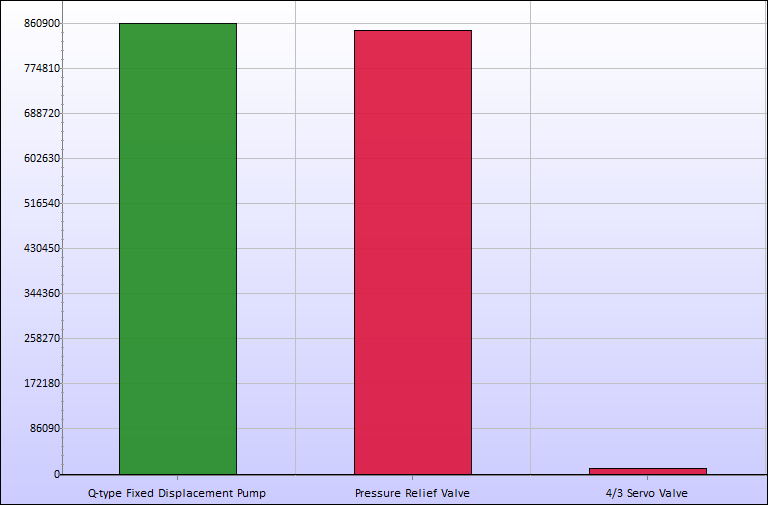
When simulating this model and clicking the energy losses icon, the following graph appears. As we can see, approximately 860 kJ is added to the pump, and most of it is lost (converted to heat and noise) at the relief valve.
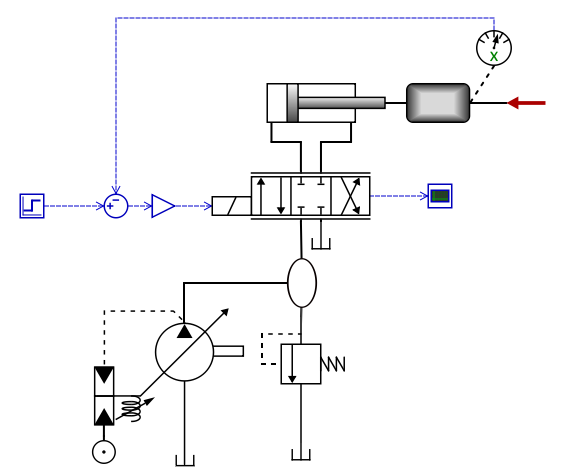
Now we will try to improve efficiency. A much better approach is to use a pressure controlled pump, so that the system pressure is adjusted from the displacement setting in the pump. A relief valve is still needed to reduce pressure peaks. Adjust the settings so that the system pressure and the step response is similar as in the previous model.
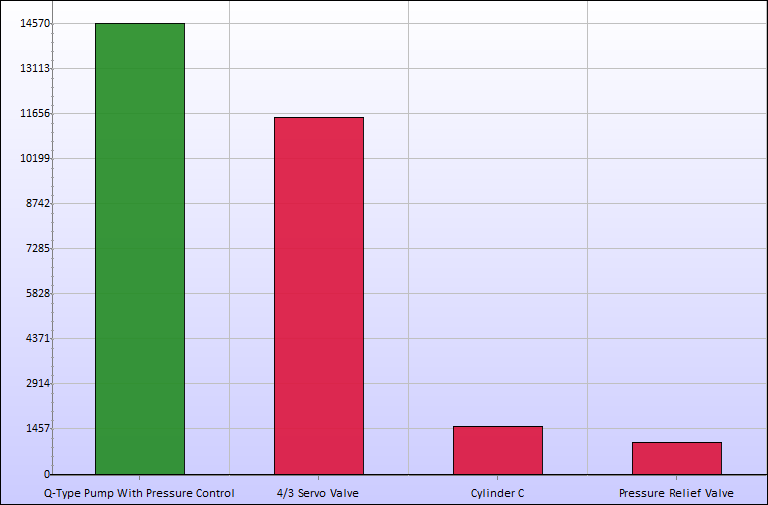
Now click the energy icon again. As we can see, the pump now only consumes about 15 kJ of energy, whereof 11 kJ is lost in the relief valve. This system thus require 57 times less energy to perform the same work!


